Statistics
An analysis of data provided by the Open PV Project, found here: https://openpv.nrel.gov/.
Income data provided by the IRS: https://www.irs.gov/statistics/soi-tax-stats-individual-income-tax-statistics-2016-zip-code-data-soi
Our team used the Pearson R Test (correlation coefficient) to determine the answer to this question:

We utilized pandas in Python to view and analyze the data, plugging the relevant variables into the equation.
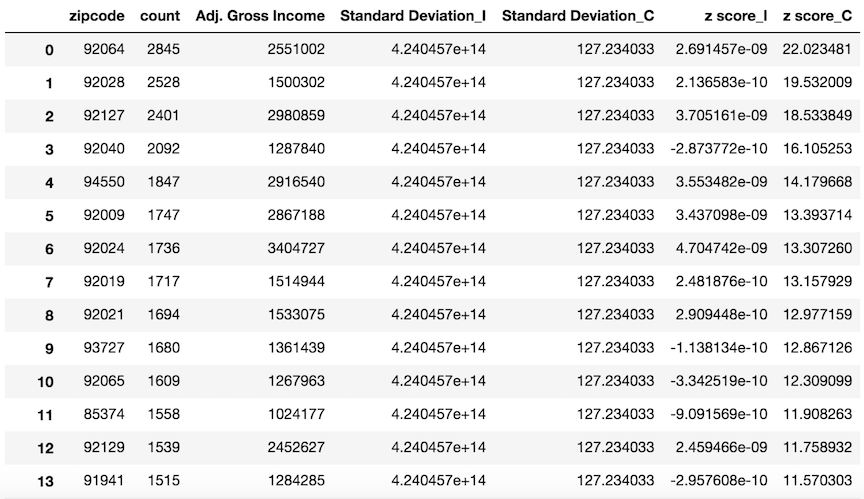
Our final result was a correlation coefficient of 0.0000006930699527680761, signifying an extremely low correlation between the two variables (the closer to 1, the more positive the correlation; the closer to -1, the more negative the correlation).
Our team had thought it was intuitive that the higher the average income, the more solar panels there would be in the area. This was due to an assumption that because the cost of solar panels are high, only higher-income areas would have a high density of solar panels. The test suggests that we were wrong, perhaps due to the density of solar panels used for farming and manufacturing, especially in rural areas with space to install them in.
Although we found that there was a negligible correlation between average household income and the amount of solar panels installed in the US, this data may be biased/skewed due to a number of variables, such as:
The full code and steps can be found at our github repository here.